Problem statement
- The problem lies in predicting a binary outcome, with 1 indicating default on loan versus 0 for non-default. Target attribute is already derived and present in the dataset under the name “Default”.
- This is a standard supervised classification task:
Supervised: The labels are included in the data and the goal is to train a model to learn to predict the labels from the features
Classification: The label is a binary variable, 0 (will repay loan), 1 (will default)
The Data
- The target variable exists in this dataset under the name “default” and indicates if clients have difficulties in meeting loan payment.
- In total we have 307511 records and 97columns
- Most of the features are Binary, Float values, or categorical
- There are lot of missing values within some features

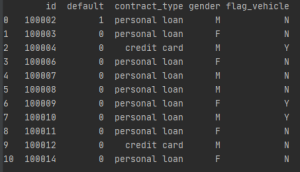
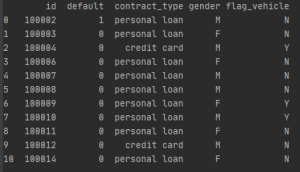
Data head showing first 11 entries of 307511 for the first five columns
Exploratory Data analysis (EDA)
EDA – Examine the Distribution of the Target Column
Percentage of Defaulters is 8.07%. Case of Imbalanced dataset. Imbalanced dataset is a scenario where the number of observations belonging to one class is significantly lower than those belonging to the other classes.
EDA-data cleaning
EDA– examine null values in data
- From my NA analysis, most of the attributes have some missing records, whereas default attribute has none.
- The attributes with missing values >=40% where drop for the Dataset
EDA– attributes with >= 40% missing values
EDA-external score
- As external score 1 has no data. External score 1 and 2 were examined see if they have any correlation with the target attribute.
- Correlation heatmap shows a negative correlation of external score 1 and 2 with attributes with the target(default). Therefore, dropped from the dataset.
EDA-Age
From an educated guess we can say that age should be negatively correlated with default rate since older people possess higher income. We need to bring age variable to a positive value and see its distribution Converting “age” to years to give a clearer picture. To show the effect of age on default I used kernel density plot. As can be seen, the non-return rate is higher for younger people and decreases with age.
EDA-Gender
The Bar chart shows that women clients are almost twice as many men, whereas men show a much higher risk.
EDA-contract type
EDA– total income
EDA-job age
Correlation matrix of selected feature
Data Preparation
Missing Data Imputation- As the first step median imputation method was chosen because omitting records with missing data could result in losing valuable information. Method is also beneficial because it overcomes the effects of skewed data with outliers.
Scaling- Data was scaled so that their mean is concentrated around zero and standard deviation is 1. Variables with huge ranges may create bias in the predictive analysis, therefore we need to get values closer to each other.
Correcting Negative values- For example, attribute “age” mostly represented negative values in days in the dataset. Therefore, all “days” variables were changed into absolute terms and represented them in years for clearer perception.
The ultimate aim of EDA is to gain insight into the datasets that enables us to choose features that have high correlations with the target variable for our machine learning model and evaluation.
The post Predicting credit risk default- Exploratory Data Analysis (EDA) appeared first on Black In Data.
